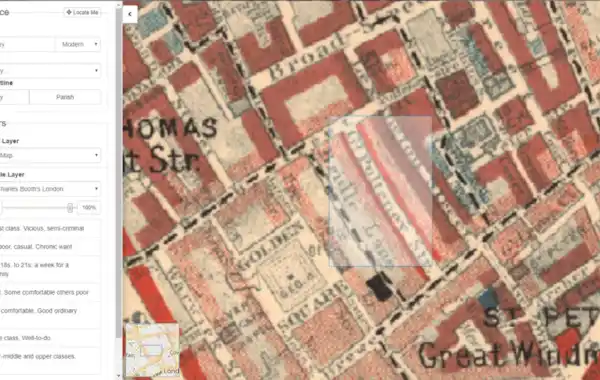
TheGenealogist’s Map Explorer now includes a feature that allows users to access Charles Booth's information-rich Poverty Maps of London to help track an ancestor's status and movements.
TheGenealogist’s innovative Map Explorer, which allows family history researchers to trace an ancestor’s property and then view the changing environment over time, now boasts another powerful new feature.
While previously researchers were able to view the georeferenced Lloyd George Domesday Survey Data Layer of maps and also see the sites of UK War Memorials, cemeteries and churchyards from across the country, TheGenealogist has now added the Booth Poverty Maps of London 1898-1899 to the resource. Researchers can now:
- Use the new Charles Booth Maps to reveal London streets classified by income and class
- Research neighbourhoods where different classes of people lived close to each other
- Use the opacity slider to view various modern day maps as a base layer to see the area today
What are the Charles Booth Poverty Maps?
Charles Booth's Inquiry Into the Life and Labour of the People in London was an investigation into the social conditions experienced by Londoners living in the late-Victorian era.
Booth’s poverty maps were pioneering in their use of colour to detail the street-by-street disparities of wealth and poverty in London. The maps were drawn from a series of “police notebooks” that Booth and his team produced by walking the streets of the Victorian metropolis.
Exploring social conditions
There were seven classifications detailed on Booth Maps, ranging from the lowest to the wealthy. Those streets coloured black were for the ‘Lowest classes. Vicious, semi-criminal’. Next was dark blue for the ‘Very poor, casual. Chronic want’. This was followed by light blue to indicate ‘Poor. 18s to 21s a week for a moderate family’. Streets in purple indicated ‘Mixed. Some comfortable others poor’. Those roads in pink were ‘Fairly comfortable. Good ordinary earnings’. Red designated a street inhabited by the ‘Middle class. Well to do’, while yellow the ‘Upper-middle and upper classes. Wealthy.’
Diamond subscribers to TheGenealogist are able to use the interface by clicking on the large map of England, Scotland and Wales on the main search page. The next screen allows the researcher to enter major street names or an area so that you can browse the locality.
Kate Winslet on Who Do You Think You Are?
In the recent BBC 1 Who Do You Think You Are? episode, Oscar winning actress Kate Winslet was researching her 2x great-grandfather, a Swedish born tailor, who lived in Great Pulteney Street, Westminster. Using this example we start typing Great Pulteney into the search box. We are presented with a choice of two from which we select the one that is in the City of Westminster, Greater London. Under Map Layers we chose the ‘Historic – Middle Layer’ and here select the ‘1898-1899 Charles Booth’s London’ from the dropdown menu. This will now highlight the street on the map.
TheGenealogist’s Map Explorer has been developed to view these georeferenced historic maps overlaid on top of modern background maps including those from Ordnance Survey and Bing Street maps, as well as a satellite view. With the Map Explorer you can search for an ancestor's property, discovering its site, even if the road has changed or is no longer there.
QUICK LINK: 3 key resources for tracing 20th-century ancestors


.jpg)